From Style Card to DISC Graph
If you have read about the 'Biaxial Model' or the Style Card in chapters I and II, you may be interested in the direct relationship between the Style Card and a more traditional DISC graph.
Note: This section assumes that you have at least a basic understanding of the DISC system. If you have never used DISC before, you might find it useful to read the rest of this chapter first, and return to this section later.
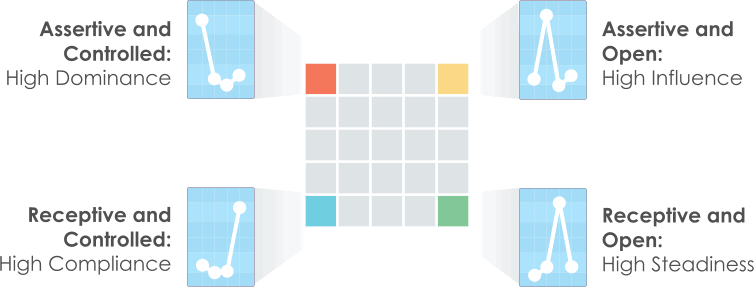
As we saw in chapter I, the intersections of the Biaxial Model (and, therefore, the corners of the Style Card's square grid) relate directly to the four DISC factors. We can relate each of these intersections to a basic DISC profile - each of the four corners relates to one of the four factors. You might like to compare the diagram below with the second diagram shown under The Biaxial Model of DISC.
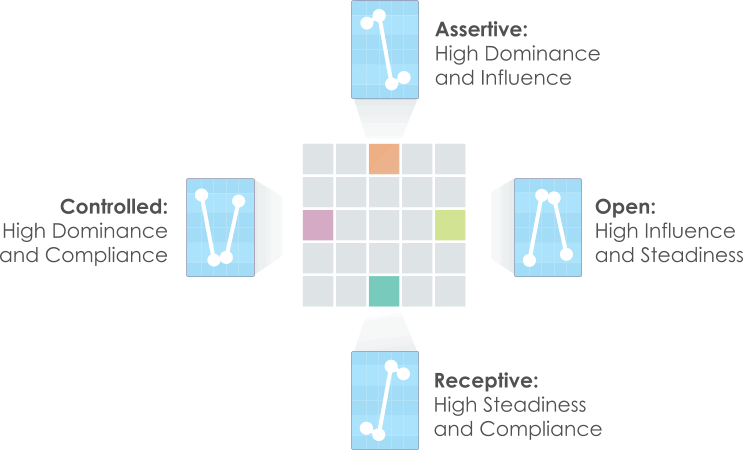
Similarly, we can derive DISC graphs for other points on the grid from their positions relative to the corners. Along the top edge of the grid, for example, the segments are close to both the Dominance and Influence corners, but relatively distant from the Steadiness and Compliance corners. These segments relate, therefore, to DISC profiles with high Dominance and Influence, and correspondingly low Steadiness and Compliance. This method can be applied to other segments in the grid, as shown in the diagram below.
Generally, each square on the grid corresponds to a DISC profile. You will notice, however that there are only twenty-five squares in the grid (some systems use as few as sixteen), while there are hundreds of possible DISC profiles. This is the reason that true DISC graphs are normally generated by measuring the four DISC factors directly, rather than using the Style Card as an intermediate stage.
Looking for your own personality report?
Understand your work style, help build your CV, and much more with your own personal report.
Download your free guide to DISC personality testing

Learn how DISC assessment can help improve your recruitment process, team building and leadership development.